Current Freight Rates – April 2024
April 15, 2024
Trucking News – US Freight Rates
April 15, 2024 – Courtesy of DAT Trendlines
April 2024 Freight Rates |
|||
| Apr 08 – Apr 14 vs. Apr 01 – Apr 07 | Mar 2024 vs. Feb 2024 | Mar 2024 vs. Mar 2023 | |
| Spot Market Loads | +2.6% | +12.3% | -14.6% |
| Spot Market Capacity | -4.7% | -6.1% | -22.7% |
| Van Load-To-Truck | +15.5% | +12.1% | +17.1% |
| Van Rates (Spot) | -0.4% | -2.96% | -7.5% |
| Flatbed Load-To-Truck | -6.7% | +35.4% | -2.9% |
| Flatbed Rates (Spot) | +0.2% | +0.6% | -8.2% |
| Reefer Load-To-Truck | +15.4% | +8.7% | +16.0% |
| Reefer Rates (Spot) | -1.4% | -2.6% | -5.9% |
| Fuel Prices | +1.6% | -0.6% | -4.7% |
Van Freight Rates – April 15, 2024
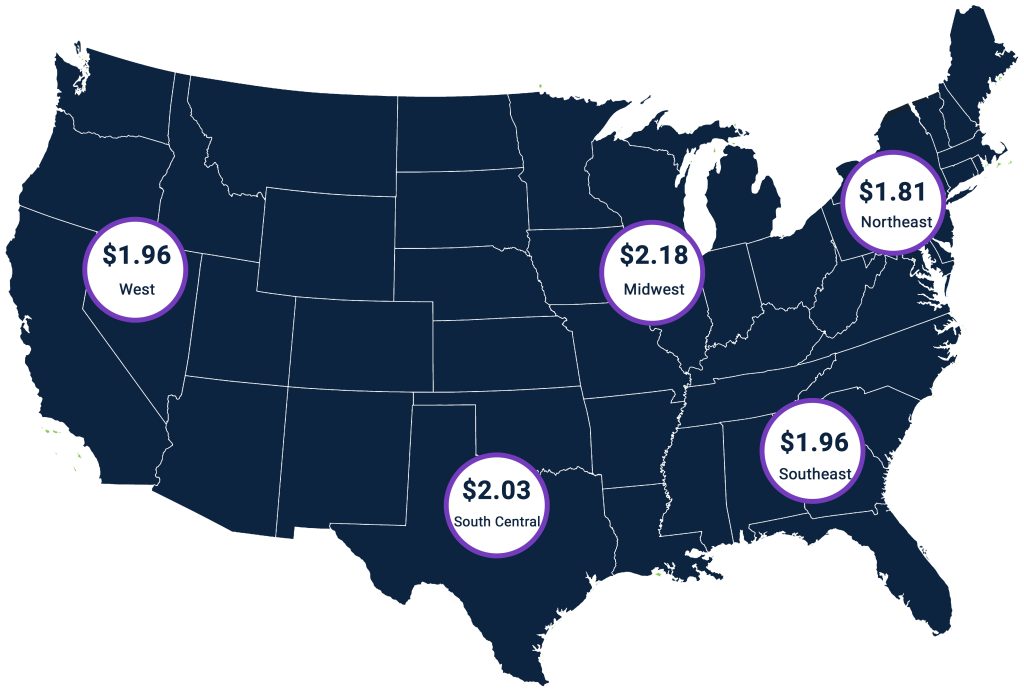
DAT.com’s April 15th Trendlines Report shows current national van rate averages are at $2.01 per mile, the same as the March average.
According to DAT, the highest average van rates are in the Midwest at $2.18 per mile. The lowest average van rates are in the East Coast at $1.81 per mile.
DAT reports the current national load-to-truck ratio is 4.00 loads-to-truck, compared to the March average of 3.13. Ratios are highest in the Southern states. The lowest ratios are in the Northern states
Reefer Freight Rates – April 15, 2024
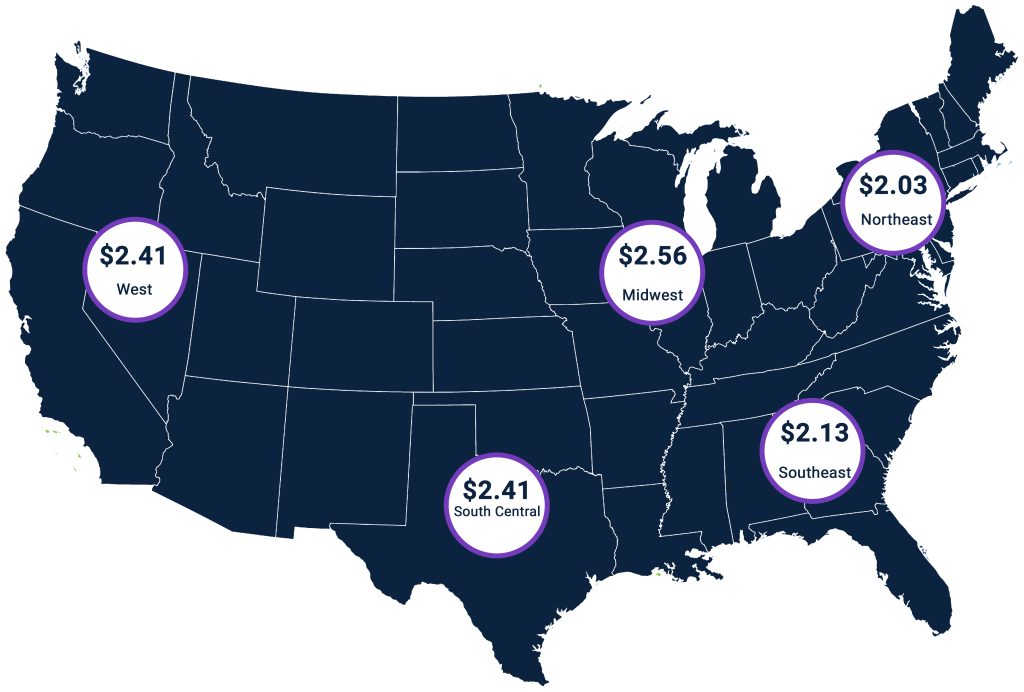
Reefer freight rates are averaging $2.32 per mile, ¢4 lower than in March. Reefer rates are highest in the Midwest, averaging $2.56 per mile. The lowest rates are in the Northeast, with an average of $2.03 per mile.
National reefer capacity is at 5.11 loads-to-truck, compared to the March average of 4.83 loads-to-truck
Current load-to-truck capacity shows reefer demand is highest in the Southern states. The Midwest states have the lowest load-to-truck ratios.
Flatbed Freight Rates – April 15, 2024
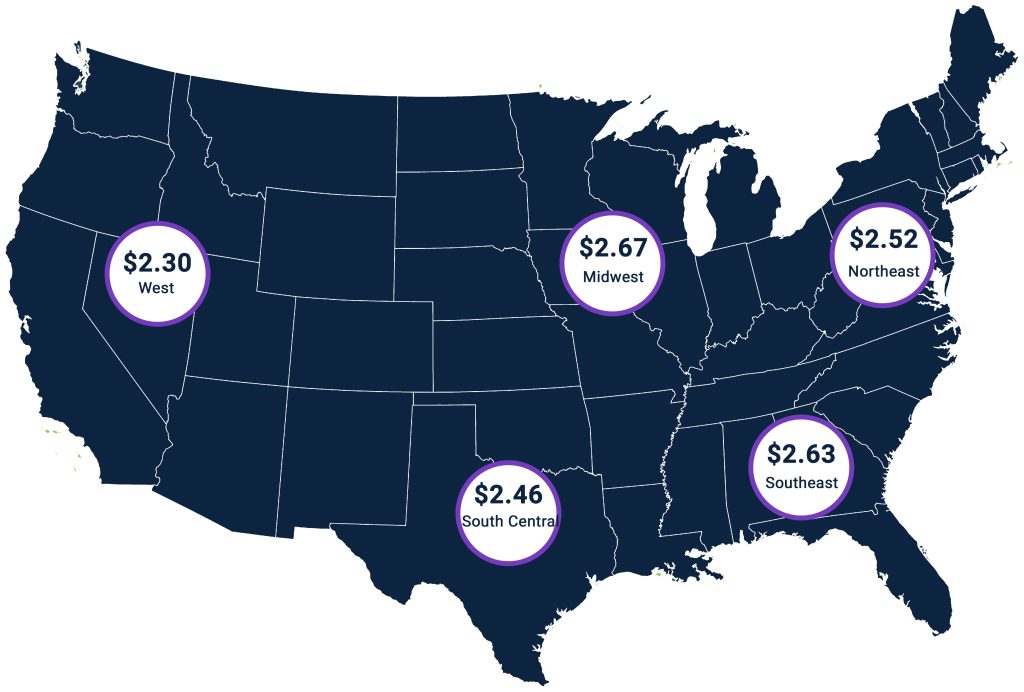
National average flatbed rates are currently $2.53 per mile, ¢3 higher than the March average.
The Midwest has the highest average flatbed rates at $2.67 per mile. The lowest rates are in the West, with an average of $2.30 per mile.
Nationally, load-to-truck ratios are at 19.66, compared to 18.35 in March. Load ratios are highest in the Southeast. The Midwest has the lowest load-to-truck ratios. For more details, visit Dat.com.
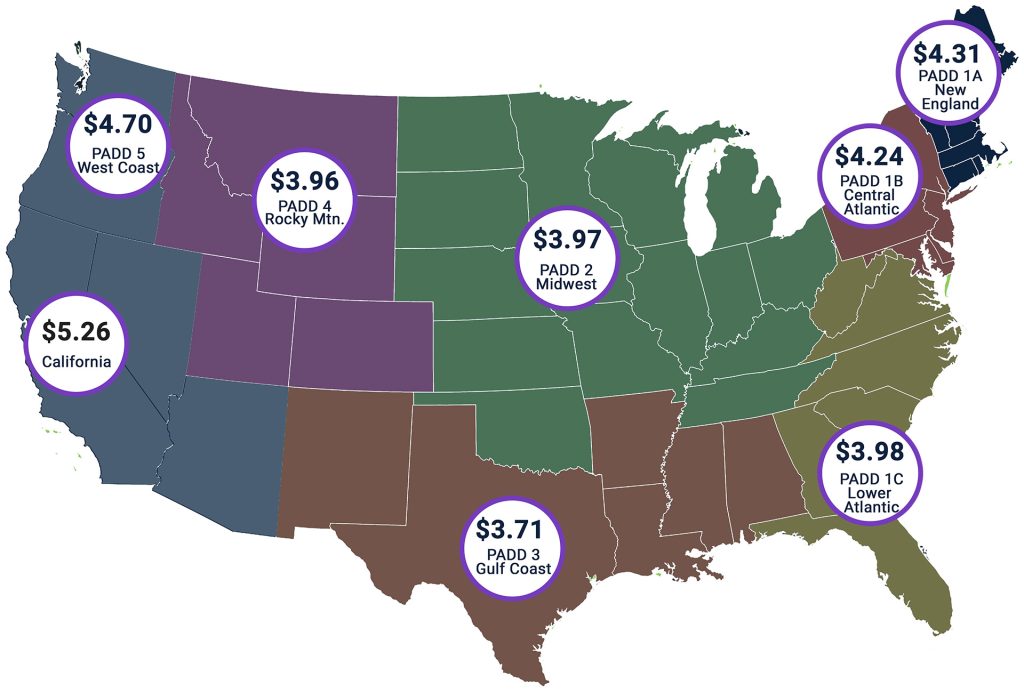
*Diesel fuel price map as of April 15, 2024.
Checking fuel prices, the national average diesel price is $4.02 a gallon compared to $4.00 one month ago and is down ¢10 compared to one year ago.
East Coast diesel prices are averaging $4.07 per gallon. The average price in the Midwest is $3.97 per gallon. California diesel prices are averaging $5.26 per gallon.
| Change from | |||||
| 04/01/24 | 04/08/24 | 04/15/24 | Week Ago | Year Ago | |
| US | 3.996 | 4.061 | 4.015 | -0.046 | -0.101 |
| East Coast (PADD 1) | 4.083 | 4.118 | 4.068 | -0.050 | -0.130 |
| New England (PADD 1A) | 4.305 | 4.305 | 4.311 | +0.006 | -0.229 |
| Central Atlantic (PADD 1B) | 4.271 | 4.272 | 4.241 | -0.031 | -0.245 |
| Lower Atlantic (PADD 1C) | 3.990 | 4.042 | 3.979 | -0.063 | -0.077 |
| Midwest (PADD 2) | 3.949 | 4.011 | 3.965 | -0.046 | -0.062 |
| Gulf Coast (PADD 3) | 3.670 | 3.760 | 3.710 | -0.050 | -0.166 |
| Rocky Mountain (PADD 4) | 3.949 | 4.008 | 3.956 | -0.052 | -0.148 |
| West Coast (PADD 5) | 4.651 | 4.723 | 4.702 | -0.021 | +0.010 |
| West Coast less California | 4.147 | 4.257 | 4.218 | -0.039 | -0.238 |
| California | 5.221 | 5.259 | 5.256 | -0.003 | +0.293 |
Factoring for Trucking Companies
Factoring Keeps Trucks Moving Forward Factoring is a common financing solution for trucking companies to access cash tied up in their receivables. Instead of waiting weeks or months for customer payment, get paid same-day with Scale Funding. We’re proud to be the top factoring company for trucking companies across the United States.
Benefits of Factoring with Scale Funding:
- 15 Minute Consultation and Quote
- Simple Setup
- Same-Day Funding
- Customized Programs
- Low Rates
To learn more about our freight factoring services, call Scale Funding at (800) 707-4845 or contact us via the web. Would you like to receive freight trends and other industry news in your inbox? Fill out the form below.


